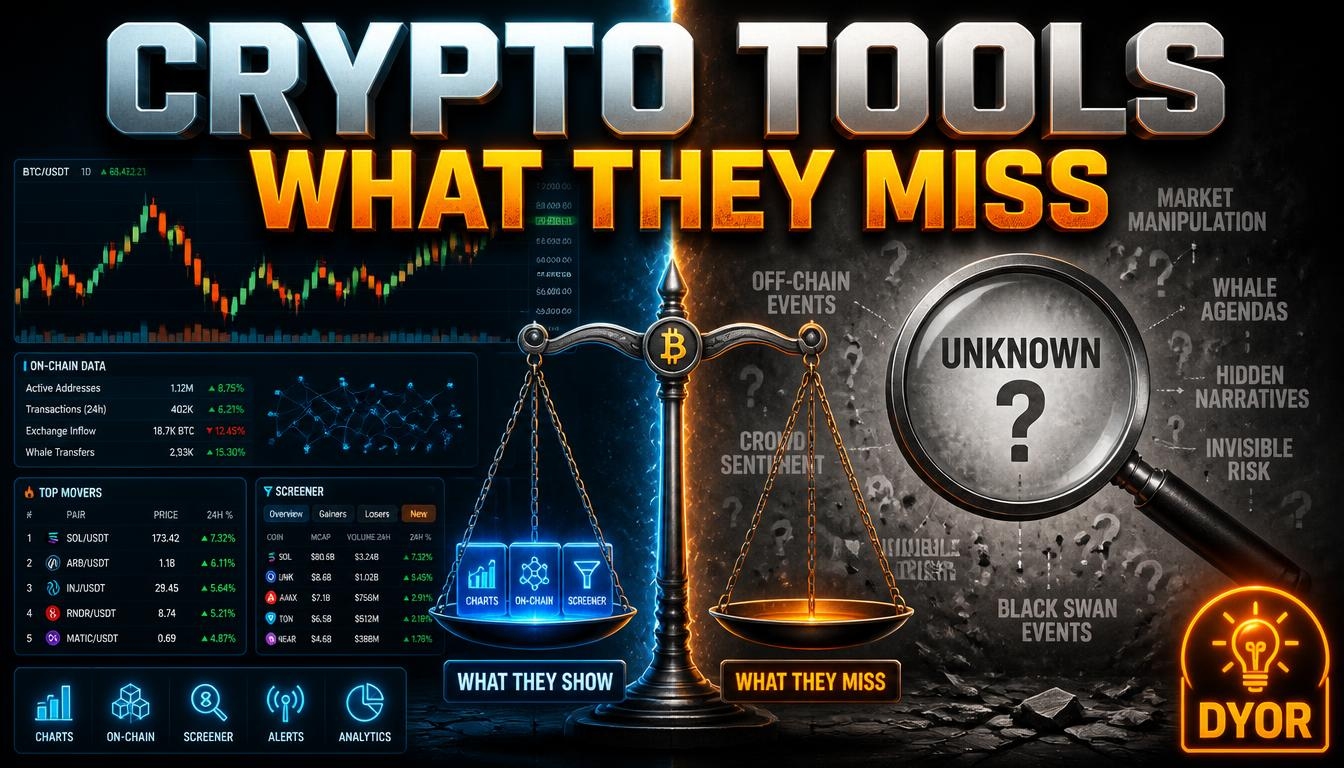
Crypto Analytics Tools: What They Show and What They Miss
Crypto has more data than almost any other market. Every transaction on a public blockchain can be seen by anyone, and dozens of tools turn that data into charts, dashboards and alerts. That is useful. It also creates a trap: lots of data feels like knowledge, and a chart can look more certain than it is.
Here is what the main types of tools show, and where each one can mislead you.
Charting and market data tools
What they show: price history, trading volume and technical indicators across timeframes.
What they miss: the future. Indicators describe the past, and many patterns people see in charts do not repeat reliably. Piling on more indicators does not make a forecast more accurate, it only makes a story easier to tell.
Screeners and market aggregators
What they show: lists of coins sorted by price change, volume, market size and more.
What they miss: reliability. Volume figures can be inflated by fake or circular trades, and small coins can be moved by tiny amounts of money. A coin at the top of a screener is not a recommendation.
Block explorers and on-chain analytics
What they show: transactions, wallet balances, token holders and flows between addresses.
What they miss: who is behind an address. Labels such as “exchange wallet” or “whale” are often estimates, and a large transfer can be someone moving money between their own wallets.
DEX analytics
What they show: new token pairs, liquidity and trading activity on decentralized exchanges.
What they miss: safety. New tokens appear constantly, and some are built to trap buyers, for example by making it impossible to sell. Always check the token’s contract address from an official source.
Sentiment and social tools
What they show: mentions, trends and the mood of discussion.
What they miss: quality. Social activity can be bought and coordinated, so a trending token may simply be a promoted one.
Alert and wallet-tracking tools
What they show: notifications when a price moves or a chosen wallet makes a transaction.
What they miss: meaning. Following a large wallet tells you what it did, not why, and copying it means you act after the move.
Token security checkers
What they show: whether a token’s code has known warning signs.
What they miss: everything they were not built to detect. A clean result lowers a risk but does not remove it.
A quick example
Imagine a token jumps 80% in a day and tops a screener. The headline chart looks exciting. A few minutes with an explorer and a token checker might show that nearly all of the volume sits in one trading pair, that a handful of wallets hold most of the supply, that the contract was created only days ago, and that one holder could remove most of the liquidity. None of that appears on the chart you started with. The tools did not fail; you simply asked them one question when you needed several.
Habits that make data more useful
- Cross-check two sources. If two tools disagree, find out why before relying on either.
- Write down your reasoning. A short note on why you made a decision lets you learn from it later.
- Note the timeframe. A signal on a five-minute chart means something different on a daily one.
- Be wary of paid “signals”. If someone could reliably predict the market, they would not need to sell their predictions to you.
- Check contract addresses yourself from the project’s official site, not from a link in a chat.
Stay safe while you research
Many dashboards ask you to connect a wallet. Connecting to view balances is usually harmless; approving transactions or spending permissions is not. Read every prompt, never sign something you do not understand, and never enter a recovery phrase on a website. Consider a separate wallet with a small balance for experiments.
A sensible way to use these tools
Treat them as a way to ask better questions, not to get answers. Before you act on any chart, ask what the data cannot tell you, who benefits if you believe it and how much you could lose if you are wrong. That habit is worth more than any single indicator.
To explore tools, browse our Crypto Data & Tools category. Rankings combine visitors measured by our tracking pixel, outbound clicks from our users, member upvotes and member reviews. A green Verified badge means the owner installed the pixel, while No pixel means the traffic is unmeasured. We list tools but do not endorse them, and nothing here is financial advice.